Sistemas y Tecnologías Web: Servidor
Master de II. ULL. 1er cuatrimestre. 2020/2021
Organization ULL-MII-SYTWS-2021 Classroom ULL-MII-SYTWS-2021 Campus Virtual SYTWS Chat Chat Profesor Casiano
Table of Contents
Performance of Web Apps
Article by Joe Colantonio, Founder, TestTalks: Tools for understanding server-side performance
Reade the original here
The performance of your web application affects your business more than you might think. Top engineering organizations consider performance not as nice-to-have, but as a crucial feature of their products. Unfortunately, most engineering teams do not regularly test the performance and scalability of their infrastructure, and most lack the tools to properly do so. Although you can find plenty of commercial tool options out there, for the right organization, free and open source tools may be a good alternative—or the perfect complement to your commercial tool set.
The value of performance
Before talking tools, let’s consider load times and the value of performance. When you understand that performance is key to a great user experience, you need tools that will do one thing very well, and that’s to measure the user’s perceived load time. There are many performance rules out there, but ultimately, that’s the only performance metric that matters.
How fast is fast enough for a web application? Here’s a quick overview of key performance metrics:
- Under 100 milliseconds is perceived as instantaneous
- A 100 ms to 300 ms delay is perceptible
- One second is about the limit for the user’s flow of thought to stay uninterrupted
- Users expect a site to load in 2 seconds
- After 3 seconds, 40% of visitors will abandon your site
- 10 seconds is about the limit for keeping the user’s attention
Engineering teams should treat performance as a feature.
The goal of performance testing is to understand how your applications behave under heavy load conditions. To get started, you need to understand the baseline performance of your application and that the performance of each transaction is unique. For example, in an e-commerce application, a home page transaction is likely highly cached and very fast, whereas a checkout transaction is more complicated and must talk to a payment service, shipping service, etc. To ensure that users have a great experience, you must test the most common flows for your users and understand performance both in the browser and on the server.
To get the job done, you’ll need server-side, client-side, and performance tools, and you can find free and open source options that fall into each of these categories.
Tools for understanding server-side performance
Apache Bench and Siege are great for quick load tests from a single endpoint. If you just need to get a sense of the requests per second for an endpoint, these are great solutions. A more advanced approach—and my personal preference—is Locust.io, an open source load-testing framework that enables complex transactions and can generate high levels of concurrency with ease. I’ve included it in the list below, along with a few other tools to consider.
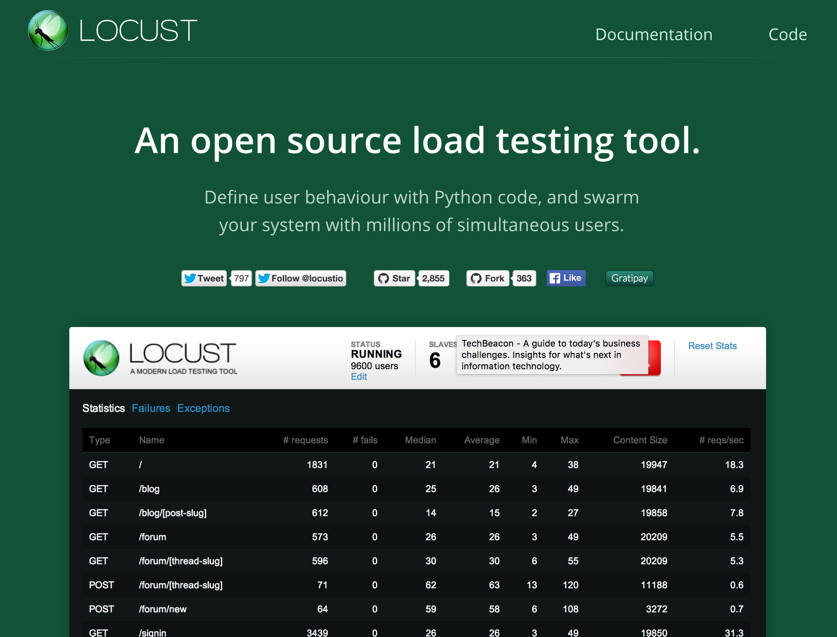
Locust.io
- Locust.io – This is a great tool for understanding the performance on the server side.
- Bees with Machine Guns – The authors describe it as “a utility for arming (creating) many bees (micro EC2 instances) to attack (load test) targets (web applications).”
- Multi-Mechanize – This is an open source framework for performance and load testing that runs concurrent Python scripts to generate load (synthetic transactions) against a remote site or service. It’s commonly used for web performance and scalability testing, but you can also use Multi-Mechanize to generate a workload against any remote API accessible from Python.
- Siege – This http load-testing and benchmarking utility was designed to let web developers measure code under duress, to see how it will stand up to load on the Internet. Siege supports basic authentication, cookies, and HTTP and HTTPS protocols, and lets the user hit a web server with a configurable number of simulated web browsers. Those browsers place the server “under siege.”
- Apache Bench – Use this tool for benchmarking your Apache HTTP server, to get an idea of how Apache performs.
- Httperf – This tool measures web server performance and provides a flexible facility for generating varied HTTP workloads and measuring server performance. The focus is not on implementing a particular benchmark but on providing a robust, high-performance tool that facilitates the construction of both micro- and macro-level benchmarks. The three distinguishing characteristics of httperf are its robustness, which includes the ability to generate and sustain server overload; support for the HTTP/1.1 and SSL protocols; and its extensibility to new workload generators and performance measurements.
- JMeter – Use Apache JMeter to test performance both on static and dynamic resources (files, servlets, Perl scripts, Java objects, databases and queries, FTP servers, and more). You can also use it to simulate a heavy load on a server, network, or object to test its strength or analyze overall performance under different load types. Finally, consider using it to make a graphical analysis of performance or to test your server/script/object behavior under a heavy concurrent load.
Tools for understanding client-side performance
Modern applications spend more time in the browser than on the server side. The best tool to use to understand client-side performance is …
- Google PageSpeed Insights, a service that analyzes the content of a web page and generates suggestions to make your pages load faster. Reducing page load times reduces bounce rates and increases conversion rates.
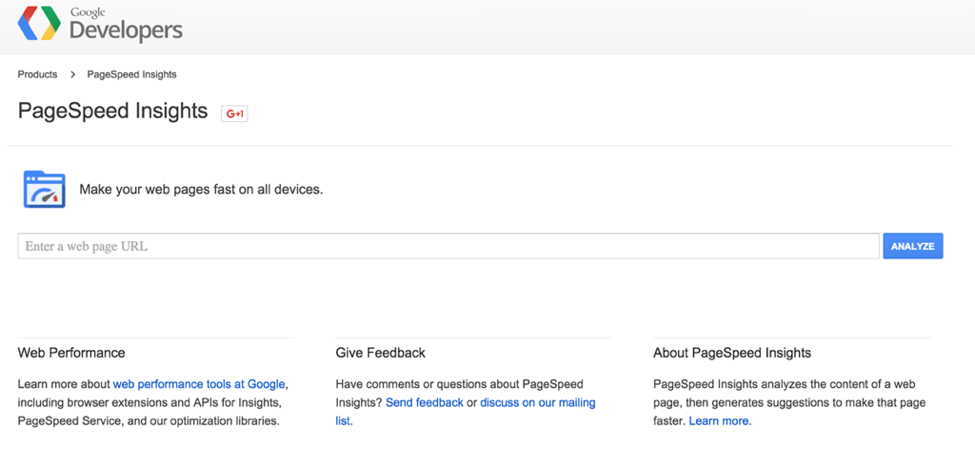
Google PageSpeed Insights
Tools for understanding real-world performance
Sitespeed.io is my favorite tool for evaluating client-side performance from real browsers. This open source tool analyzes your website’s speed and performance based on performance best practices and timing metrics. You can analyze one site, analyze and compare multiple sites, or let your continuous integration server break your build when you have exceeded your performance budget.
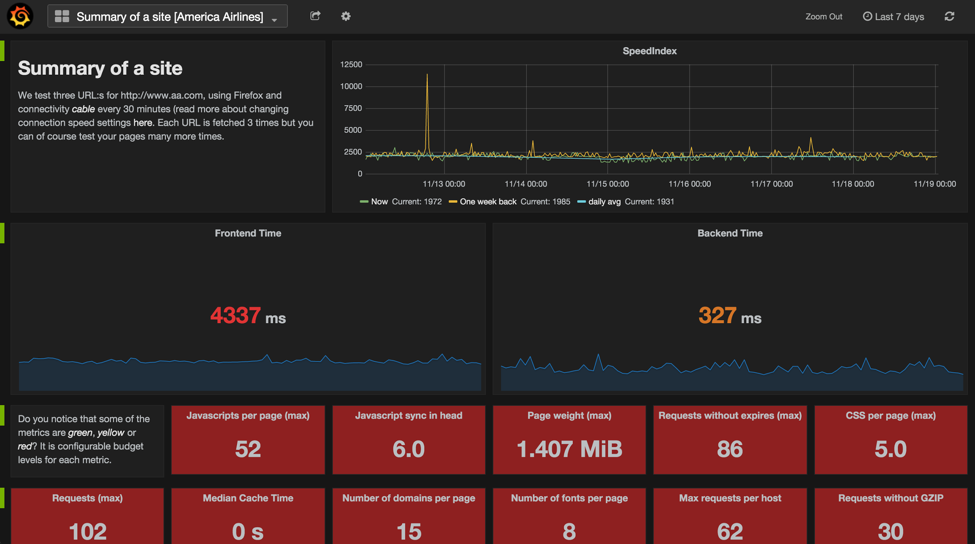
Sitespeed.io
It is not always possible for teams to modify the applications to optimize client-side performance. Fortunately, Google invested in making ngx_pagespeed and mod_pagespeed as web server extensions to automate performance improvements without the need for code changes. Here’s a description of each, as well as one other useful tool:
- Google ngx_pagespeed speeds up your site and reduces page load time. This open-source nginx server module automatically applies web performance best practices to pages and associated assets (CSS, JavaScript, images) without requiring you to modify your existing content or workflow.
- Google mod_pagespeed speeds up your site and reduces page load time. This open-source Apache HTTP server module automatically applies web performance best practices to pages and associated assets (CSS, JavaScript, images) without requiring that you modify your existing content or workflow.
- WebPagetest.org provides deep insights into the performance of the client side in a variety of real browsers. This utility will test a web page in any browser, from any location, over any network condition—and it’s free.
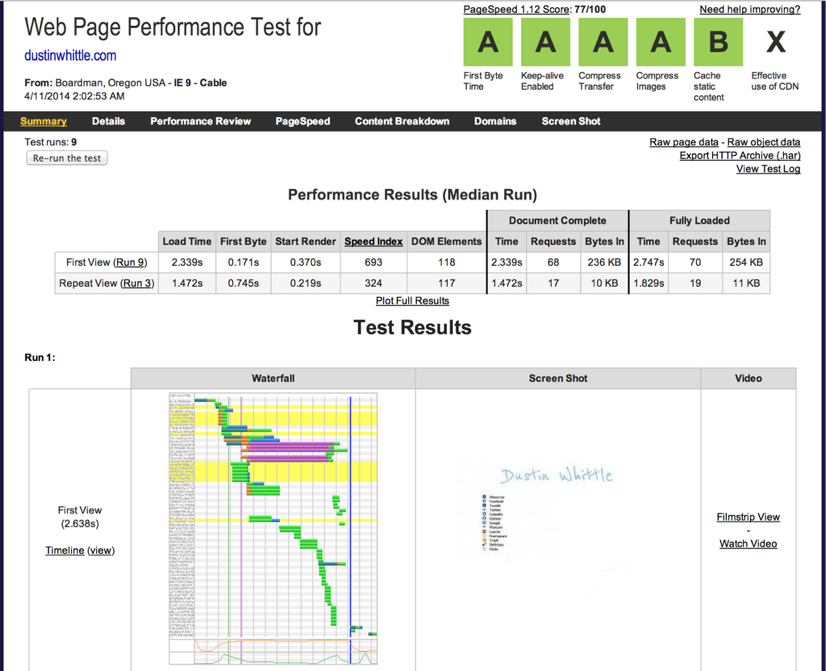
WebPagetest.org
Choices and tradeoffs
While you have a wide choice of open source tools from which to choose for performance management, it’s not always wise to build and manage your own performance testing tools and infrastructure. You may determine that it’s not worth the engineering resources required to load test when you can pay for a proven commercial product or service. Such tools let you more easily build, execute, and analyze performance tests, but you have to be willing to pay for it.
Should you go with open source, or will a commercial tool provide more value? Only you can decide if it makes sense to use open source—and if your organization has the engineering resources required. If you do, many of the tools I’ve discussed above should go right into your toolbox.
Taken together, these free and open source tools offer a path to get started on capacity planning and load testing on the server side, optimizing and performance testing the client side, and monitoring performance from end to end to derive meaningful insights from performance tests. What are your favorite tools? Add your comment below.
Image credit: Flickr